Login with Facebook

Sunday, December 28, 2014

Videos: HP NNMi iSPI Performance reports

General usage of the iSPI Performance reports. Learn how to launch and manipulate reports, change your topology and time filters, set topology groupings and your metric choices.

Source: http://h30499.www3.hp.com/t5/Network-Node-Manager-Support/Video-NNMi-iSPI-Performance-Reporting-Usage-and-Navigation/td-p/6672920#.VJ9-3ujBJU

----

NNMi iSPI Performance - Creating Report Views

This presentation shows you have to save time when running reports by creating report views with your most commonly used selections.

Let's us know what you think of this video and if you would like to see more in the future. http://h30499.www3.hp.com/t5/Network-Node-Manager-Support/Video-NNMi-iSPI-Performance-Creating-Report-Views/td-p/6672930#.VJ9-3ejBJU


-----

This presentation illustrates how to create report schedules for faster data access and automated report delivery.

HP Network Node Manager i Software—HP Business Service Management/Universal CMDB Topology Integration Guide


The HP Business Service Management (BSM) platform provides tools for managing the availability of applications in production, monitoring system performance, monitoring infrastructure performance, and proactively resolving problems when they arise.

The HP NNMi–HP BSM/UCMDB Topology integration populates NNMi topology into either the BSM Run-time Service Model (RTSM) or the UCMDB database. Each device and device component in the NNMi topology is stored as a configuration item (CI) in RTSM or UCMDB. BSM or UCMDB users and integrated applications can also see the relationships between NNMi managed layer 2 network devices and BSM-discovered or UCMDB-discovered servers, hosted applications, and more.
Additionally, the integration stores the identifier of populated CIs in the NNMi database. Uses for the CIs of the NNMi-managed devices include the following:

  • NNMi components in the MyBSM portal.
  • Path health views available from the BSM Real User Monitor (RUM).
  • Using the agent implementation of the HP NNMi—HPOM integration, and pointing to a BSM Connector, results in an HP NNMi–HP BSM Operations Management integration that associates incidents regarding NNMi-managed devices with BSM CIs.
  • The comprehensive relationships maintained by RTSM or UCMDB enable an NNMi operator to view the impact of a network access switch infrastructure failure on other supported devices and applications. The NNMi operator selects an incident or a node in NNMi and then enters a request for impacted CIs.

image

Full details are in this document http://support.openview.hp.com/selfsolve/document/KM00830093/binary/nnmi_integration_business_service_mgmt_10.00.pdf

Saturday, December 27, 2014

Videos: HP Service Health Reporter

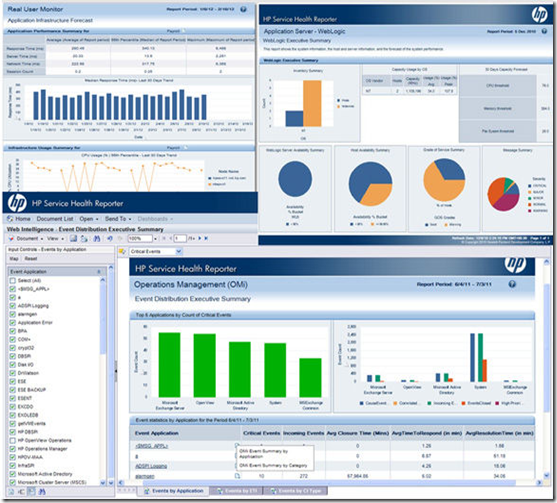
These two videos shows HP SHR reports extended value when integrates with HP NNMi and HP OMi

First video illustrating Network reporting use cases in HP SHR

Second video illustrating OMI Event Reporting use cases in HP SHR

Saturday, December 20, 2014

Free NNMi, How to install Video

HP Network Node Manager i (NNMi) provides powerful capabilities to enable your network operations team to efficiently manage a network of any size, reduce the business risk of downtime, and increase network service levels. NNMI is the one solution for managing fault, availability, performance and advanced network services for your physical, virtualized, hybrid, and cloud network environments.

Now NNMi Community Edition is available for download absolutely free so you can experience the power of Network Node Manager i. This edition enables your network operations team to effectively manage a network of 25 devices at no cost.

http://www8.hp.com/uk/en/software-solutions/network-management-automated-network-management/try-now.html

Video: Align IT and the business with information insights

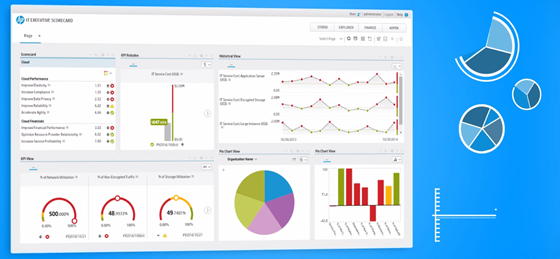
The HP IT Executive Scorecard automates the process of gathering performance and financial information. It then makes it simple to see how well you are doing across IT and business objectives by building and displaying Key Performance Indicators.

  • Leverage a library of 180+ KPIs, objectives, dashboards, and reports all based on best practices and years of research.
  • Tailor a dashboard with drag-and-drop functionality to meet the needs of specific personas, and allow users to drill to details or modify their view, for example, with different types of graphs.
  • Get more meaningful insights by using aggregates and maps data from multiple HP and third-party sources.
  • Enable everyone—project managers, business relationship managers, VPs, and Directors, service owners, anyone—to benefit from analytics focused on their area of interest.

XS2XS3

Friday, December 12, 2014

HP OneView Videos: Getting started, Automation, Easy Navigation and Analytics

  1. Getting started with HP OneView

HP OneView delivers unprecedented ease of use so you can deploy faster, at a lower cost and at virtually any scale

  • HP OneView 3PAR and VMWare automation and seamless integration

HP OneView is the foundation for managing HP CI across servers, storage, and networking. The new HP vCenter plugin integrates VMware vCenter with HP OneView for full..


  • Provision an ESX cluster in minutes with HP OneView

HP OneView enables you to set up an ESX cluster to host a VMware environment in minutes. Intelligence and automation designed into HP Oneview removes many manual s...


  • HP OneView: Navigate the data center easier than Cisco UCSM

Carefully plot device interrelationships before making changes. The HP OneView Map View charts infrastructure interrelationships in your datacenter simply & easily with a single visualization versus multiple screens and tabs with Cisco UCS Manager.


  • Operations Analytics and the Software-Defined Datacenter

Industry analyst Bernd Harzog of The Virtualization Practice explains why analytics software is essential to the SDDC management stack.

  • Analyzing OneView Data using HP Operations Analytics

HP Operations Analytics now supports a robust integration with HP OneView. This allows you to import data from HP OneView and analyze it in HP Operations Analytics. The data is displayed in specialized dashboards. This video shows you how you can use this integration to get more from your data.

Thursday, December 11, 2014

OMi Monitoring Automation

OMi Monitoring Automation(OMi M.A.) automates the configuration of monitoring for infrastructure and composite applications. It detects new instances of components, from servers to composite applications, and maps them to predefined management templates and “aspects” that model to the desired configuration and resource type.


image

Interactive Report Views in HP Service Health Reporter

Video illustrating how to make the best use of the Interactive mode of viewing reports in HP Service Health Reporter

image

Working with Alerts in HP Operations Analytics

HP Operations Analytics now enables you to create alerts based on metric and log data. you can specify the conditions of the alert, allowing you to proactively monitor known issues and prevent escalations. This video shows you the basic steps of creating an alert by showing you one use case.

image

To learn more about HP Operations Analytics visit: http://www8.hp.com/us/en/software-solutions/operations-analytics-operations-analysis/index.html

Wednesday, December 10, 2014

HP OMi: How to connect an HP Operations agent

In this video, you will learn how to connect an HP Operations agent to OMi so you can monitor availability and performance and remediate issues on a monitored server.

image

OMi is the only product that dynamically and automatically discovers and correlates—even as the environment changes—three sets of data: event data that indicates infrastructure- or service-impacting issues, for more details check OMi data sheet  http://h20195.www2.hp.com/V2/GetDocument.aspx?docname=4AA2-3879ENW&cc=us&lc=en

Sunday, November 30, 2014

HP vPV YouTube videos

Virtualization Performance Viewer (vPV) Overview | HP

http://youtu.be/YDb5_bNwhms

HP vPV - Quickly identify performance bottlenecks in virtualized environment

http://youtu.be/fnBK7VMLjd8

HP vPV - One tool; Many environments - Vendor neutral design

http://youtu.be/fu7_Wlq3BdM

HP vPV - Perform rapid triage analysis and troubleshoot problems in virtualized environment using the workbench

http://youtu.be/hSAtSHGUfgY

HP vPV - Advanced performance troubleshooting using Real Time Guest OS Drilldown

http://youtu.be/xnuOb07A3Sk

HP vPV - Discover means to optimize & right size the virtualized environment

http://youtu.be/G56oafzOr9o

HP vPV - VM placement recommendations for new virtual machines

http://youtu.be/0rEKal0H870

HP vPV - Using vPV to resolve performance problems in OpenStack environment

http://youtu.be/Mdne06aABp8

HP vPV - An overview of out-of-the-box reports offered by vPV

http://youtu.be/UCjtSIFshAI

HP vPV - Getting started with vPV

http://youtu.be/wYnmA_DuBKk

HP vPV - Detect and resolve performance anomalies using alerts

http://youtu.be/IMEpeIVaIbg

HP vPV - Capacity planning made easy with utilization forecast

http://youtu.be/wg-_zeKTP6I

HP vPV - Integrated capacity planning and provisioning in virtual datacenters

http://youtu.be/qodmrrKVua8

HP vPV - Improve the operational efficiency of the virtual infrastructure in the cloud      

http://youtu.be/v3MKOiI8B7E

HP vPV - Capacity planning through what-if modelling and analysis          

http://youtu.be/TpCa_K3we6s

image

image

image

Note: All vPV videos are now listed in this YouTube Playlist.

Wednesday, March 5, 2014

Topology Based Correlation using OMi

“I have to write any article to my blog, I have to get back to my audience” this is what consumes my mind during the last year. Although I hadn’t wrote any articles but I had a wonderful challenging year. From time to time, I write articles but they are always saved in the draft.

So it is the time to be back again.

I have a test lab and I had seen some messages that was generated from my domain controller but those events should be taken care by many team; supposing we are in real scenario.

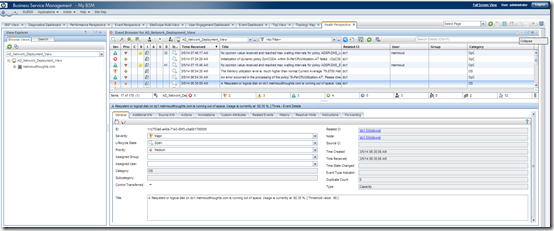
I have disk capacity issue in dive C where Active Directory DIT files are stored.
image

At the same time, the Active Directory team is monitoring domain controller with Active Directory related policies and they have been alerted with the below events.

image

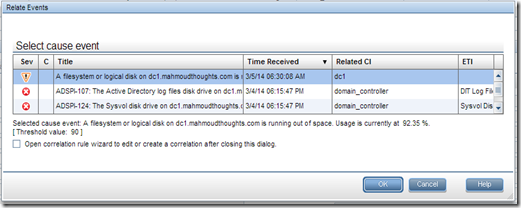
We need to tell both admins which event are root cause and which event are symptoms.

I will select the four alerts and Click on “Relate Events”

image

Select the identified Root event.

image

You can see now the event are categorized as root and symptoms under (C)orrelation column.

image

When you open any of the events you can see the correlation on “Related Events” tab.

image

What I have just done, is just manual correlation.

I have apply the same concept but with automation based on OMi topology based event correlation which Checks the events associated with Health Indicators against Topology relations as in our case we have filesystem connected with node that hosts domain controller. So if events with HI associated with FileSystem and other events with HIs associated with DomainController the can be correlated with the presence of TBEC rule as below.

I will select the events that has the HIs as below.

Note: I have selected one more event related to Node, to ensure that I will have the right topology relations


image

Then Identified the root cause event.

image

Give the Rule Name and description


image


It is just fun to create correlation rules, and you can let your operators focus on root cause events.